Auto Design
Computer-Aided Design (CAD) is used to model and test car designs. Before 1980, engineers would build a full-scale model to test a new design. Now, mathematical models are used for these tests. Some models are based on polynomials determined by solving large systems of equations. Matrices are used to solve these large systems.
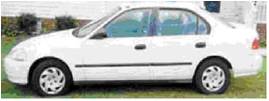
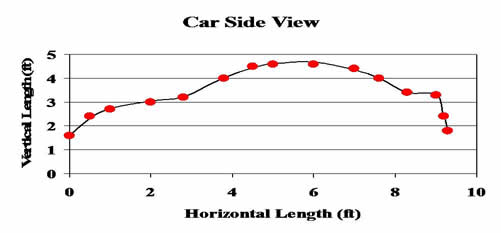
For the Honda Civic shown here, a grid was created over the the picture and ordered pairs were taken along the contours of the car.
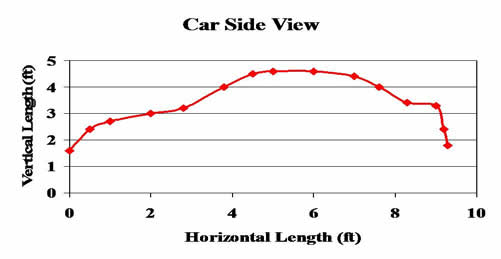
| x | 0 | 0.5 | 1 | 2 | 2.8 | 3.8 | 4.5 | 5 | 6 | 7 | 7.6 | 8.3 | 9 | 9.2 | 9.3 |
| y | 1.6 | 2.4 | 2.7 | 3 | 3.2 | 4 | 4.5 | 4.6 | 4.6 | 4.4 | 4 | 3.4 | 3.3 | 2.4 | 1.8 |
These data points can be modeled by fitting polynomial equations of a chosen degree. For this data set, three cubic polynomial models were chosen.
Here is the plotted data.
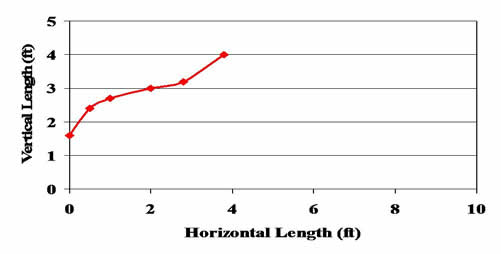
The first data set to be modeled:
Second data set:
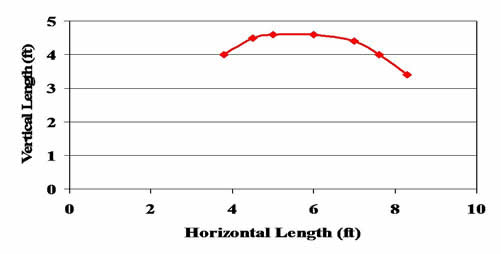
Third data set:
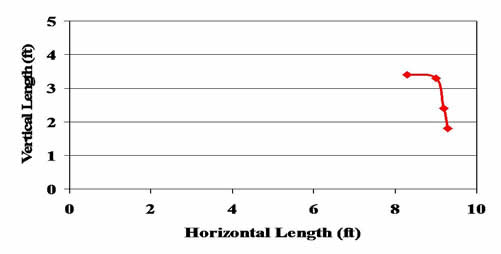
Each of the three pieces of the data set will be modeled by a different polynomial function. As an example, we will model the first data set.
| x | 0 | 0.5 | 1 | 2 | 2.8 | 3.8 |
| y | 1.6 | 2.4 | 2.7 | 3 | 3.2 | 4 |
To model this data, we will use a cubic polynomial
![]()
To find the values of a , b, c, and d, we need to choose four data points from the set. Using (0, 1.6), (1, 2.7), (2, 3), (3.8, 4) and substituting these values into the cubic model, we get the following system of linear equations.
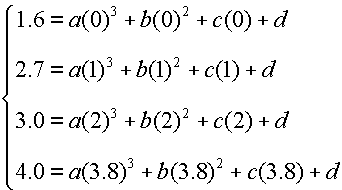
The augmented matrix for this system is
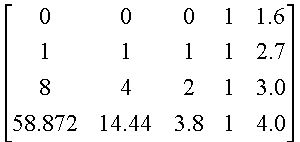
The reduced row echelon form for the augmented matrix of this system is
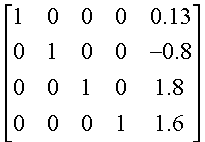
The cubic model is
Here is the model together with the original data:
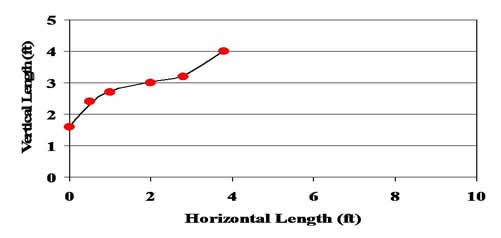
In a similar fashion, we can find polynomial models for the two remaining data sets and combine them as a piecewise defined function. Here is the data (in red) together with the final piecewise polynomial model.
